Introducing the Qwilka Subsea GIS
I have just set up a demonstration GIS (geographic information system) for my subsea data company Qwilka. It is built using the open source web mapping library Leaflet, which is light-weight and easy to program. The plan is to use the Qwilka Subsea GIS to display openly available data related to the subsea oil & gas industry. The base map is taken from GEBCO which provides a global map with ocean bathymetry. There is also an alternative base map from OpenStreetMap with more land based details like borders, roads and cities.
Go to webpage:
Qwilka Subsea GIS
Hovering the cursor over the layer control  at the top-right enables selecting data layers for display. The attribution box on the bottom-right
  provides links to the sources of the displayed data (links will open in a new browser tab/window). Right-clicking on the map brings up a popup that displays the location coordinates:
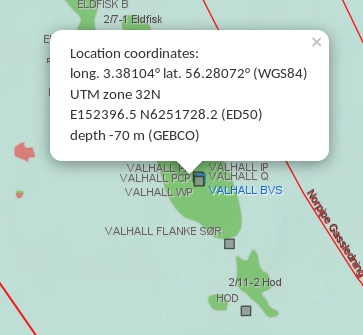
Right-clicking at a location gives coordinate information.
To start with, I will focus on adding data provided by WMS (web map service) providers, because that’s the easiest to set up, it merely involves passing on data that is hosted on the provider’s WMS server. Presently there are subsea infrastructure data from the NPD (Norwegian Petroleum Directorate) and the Irish Government. I will be adding more open WMS data in due course, as I identify suitable providers.
There are many other authorities providing subsea infrastructure data in various formats which usually require some processing to convert into a format that can be rendered on the GIS. I am planning to add these data also, in due course. Here is a list of some of the open subsea data that I am planning to look at:
If you know any other relevant data sources, I would be interested to know about them! I hope you find the Qwilka Subsea GIS interesting, in time I am planning to develop it into a useful reference tool for subsea engineers.